Unlimited payment cards with a remote and hassle-free account setup process along with SEPA, FPS and SWIFT transfers
100 +destinations
7 yearsin the market
1000 +accounts opened
Cards for all your needs
A comprehensive range of payment cards, with up to 10,000 cards per month, easy card management, API integration, and top security features.
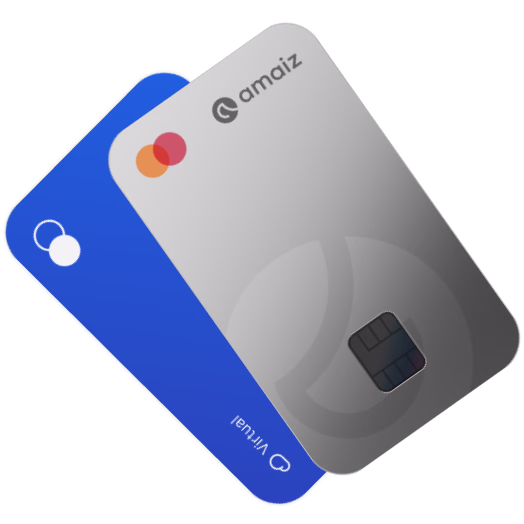
Debit Card of your choice — Virtual or Plastic
Any card purchase you make is protected by Mastercard. If there is any issue with the purchase, you can request a refund.
Card-as-a Service
Build your own card product with ease
Mass Card issuing
Whether you need 100 or up to 10,000 cards per month, we've got you covered.
Easy Card management
Use your Mastercard in the UK, online, or abroad with no hidden fees.
PCI DSS certified
Rest assured that your information is protected and has the highest level of data security with our PCI DSS certification.
Transfer Money Worldwide
Simply complete our online application, pass the compliance check, and you'll have access to your account.
Sender country
Recipient country
Available Currency
Why choose Amaiz?
Features that transform your payments
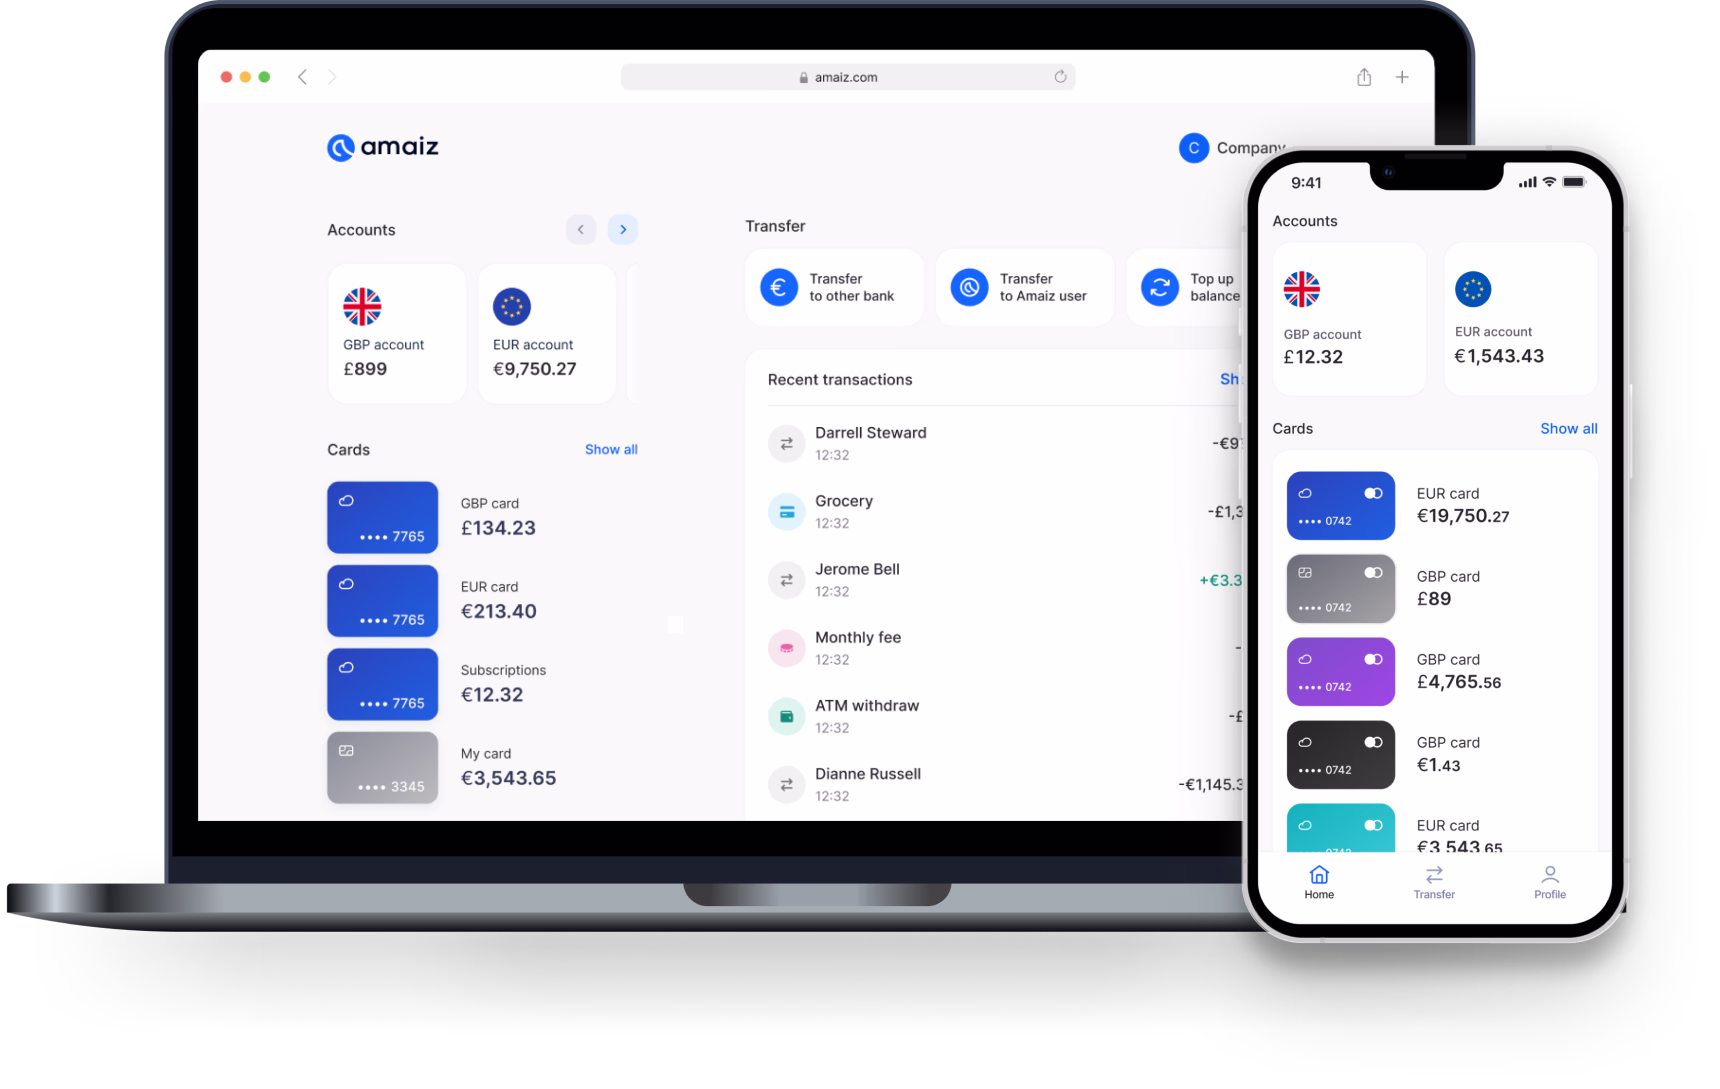
GBP & EUR accounts
Empower your payments with a unique Sort Code and Account Number for UK payments and an IBAN for international payments.
Regulated & Secured
We follow strict FCA protocols and hold your funds in a safeguarding account to ensure your secure banking experience.
100% Digital setup
Opening an account is quick and hassle-free. Simply complete our online application, and you’ll have access to your account with no need to visit a branch.
Personalised Solution
Each customer is unique, and our banking solution is designed to meet the needs of all customers, from individuals to high-risk entities.
Try free demo account
Enter your email and we will send you a link to the demo account
Easy Account Setup
Simply complete our online application, pass the compliance check, and you'll have access to your account
1
Complete the application
Tell us about your company and the nature of your business
2
Complete KYC check
Upload all necessary corporate documents to finalise the KYC process
3
Accept pricing
After the KYC check, we will provide you with a special offer and terms
Pricing
Our pricing starts as low as £0 per month, and your fees depend on your business.
Business
Onboarding fee: Free
£0/ Month
Business +
Onboarding fee: £100
£49/ Month
Enterprise
Onboarding fee: £250 - £1000
£99/ Month
The final decision is based on your risk profile
Interested in discussing a tailored offer for your business?